 (1)")
Apache ECharts: An Open Source JavaScript Visualization Library
JS Library ที่สามารถทำ Visualization ได้มีหลายตัวครับ เช่น FusionCharts ซึ่งอาจจะมีค่าใช้จ่ายบ้าง วันนี้ผมขอแนะนำอีกตัวที่เป็น open source JS library ที่ใช้งานได้ฟรีโดยไม่มีค่าใช้จ่ายครับ นั่นคือ Apache ECharts
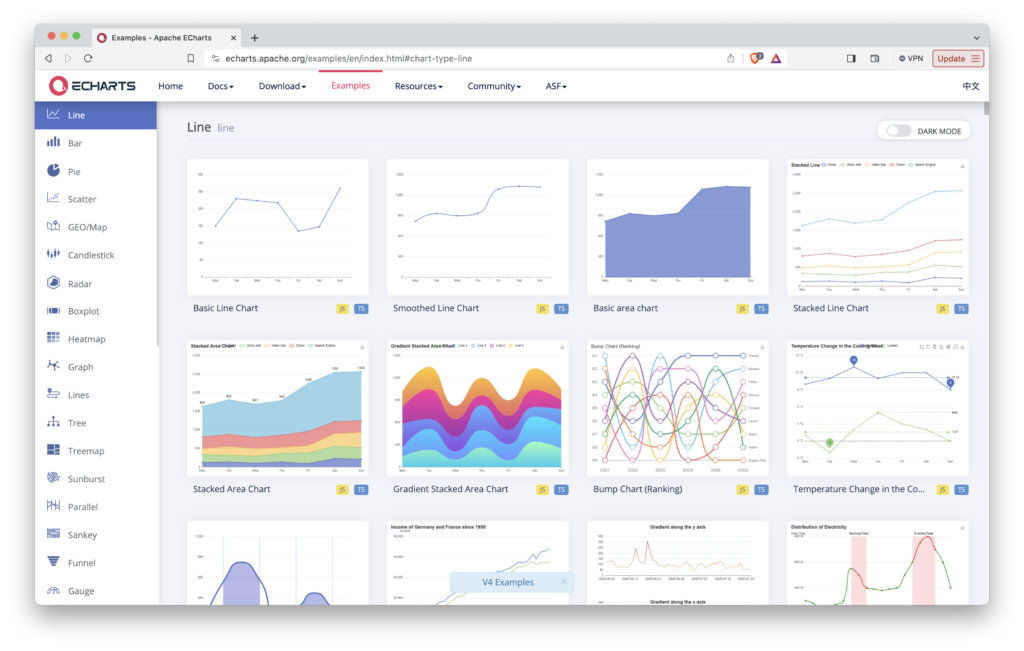
โดย library นี้สามารถสร้าง chart ในรูปแบบต่างๆ ได้มากมาย เช่น
- Line
- Bar
- Pie
- Scatter
ซึ่งตัวอย่าง code ของการสร้าง chart แบบต่างๆ ดูได้จาก https://echarts.apache.org/examples/en/index.html ได้เลยครับ


")
")
")
")
")